Bitcoin Weekday Intel
Monday, 08/24/2026
Strategic News
Global macroeconomic conditions continue to skew heavily in favor of digital asset expansion as markets absorb clear dovish signals following the Jackson Hole Economic Symposium. Federal Reserve commentary over the weekend reinforced market expectations for an aggressive monetary easing cycle starting at the September FOMC meeting. The broader liquidity landscape is expanding rapidly as U.S. Treasury debt buyback operations continue to pressure long-end yields, keeping the U.S. Dollar Index (DXY) pinned near multi-month lows.
On the policy front, legislative momentum surrounding strategic reserve assets has intensified. With the SEC’s recent publication of “Regulation Crypto Assets” establishing formal market-structure guidelines and state-level treasury committees reviewing CFTC custody frameworks, institutional allocators and municipal pension managers are laying the groundwork for direct spot exposure ahead of Q4 budget cycles.
Corporate Treasury & Institutional Drivers
Bitcoin maintained exceptional structural strength over the weekend, absorbing localized profit-taking without surrendering recent breakout gains. Spot demand across institutional venues remains resilient, keeping price action locked near the $77,900 threshold as New York liquidity desks come online for the new trading week.
Institutional Spot ETF products capped off their strongest weekly inflow performance in ten months, absorbing nearly +$1.92 billion in net cumulative capital across major issuers over the past trailing sessions.
Strategy (MSTR) Treasury Note: Balance sheet reserves remained unchanged over the last 24h at 843,775 BTC (~$65.5B) alongside a $3.75B USD liquidity buffer.
Important Variables
Data gathered at 10:30 UTC
| Variable | Value | Notes / Status |
|---|---|---|
| Bitcoin Spot Price | $77,955.57 | Consolidating near local highs; strong upper shelf holding |
| Bitcoin 24-hour change in price | +0.29% | Tight weekend consolidation following historic weekly expansion |
| Aggregated 24h Spot Volume | $38.40 Billion | Healthy baseline weekend turnover transitioning into Monday open |
| Spot ETF Net Flow (Trailing Session) | +$482.0 Million | Sustained institutional accumulation heading into new trading week |
| Bitcoin Market Dominance | 58.1% | BTC consolidating market share leadership at cycle highs |
| 7-Day Price Range | $64,117 – $77,955 | Decisive structural expansion (+21.5% over the 7-day window) |
| Upper Resistance Level (Last 24h) | $78,500.00 | Major ask wall concentration before psychological $80,000 |
| Lower Resistance Level/Support (Last 24h) | $76,900.00 | Intraday dip low firmly defended by passive limit bids |
| Order Book Depth Ratio ($\pm 2\%$) | 1.12 (Bid-Heavy) | Spot buyers actively absorbing overhead sell orders |
| Total Open Interest (OI) | $29.40 Billion | Modest OI expansion without destabilizing leverage buildup |
| Long/Short Ratio (Binance/OKX) | 1.11 (52.6% Longs) | Balanced positioning; absence of speculative long crowding |
| Predicted Funding Rate | +0.0072% | Moderate positive baseline; well below frothy liquidation levels |
| 24h Liquidations (Long / Short) | $18.2M / $46.5M | Muted liquidations as price stabilizes within an orderly channel |
General Market Summary
Over the last 24 hours, Bitcoin has exhibited classic bull-market consolidation, converting prior resistance levels into firm structural support. After dipping to an intraday floor of $76,900.00, steady spot absorption pushed price action back up toward range highs at $77,955.57, where it continues to hover cleanly above $77,600.
Price movement indicators and volatility metrics point to an orderly market environment rather than a speculative bubble. The Predicted Funding Rate (+0.0072%) remains grounded near baseline, while the Long/Short Ratio (1.11) demonstrates that derivatives traders are not over-leveraged. As long as passive spot bids continue defending the $76,900 support shelf, overhead pressure against the $78,500 ask wall will build, keeping the path clear for an eventual test of $80,000.
BTCSunrise Comments
Good morning Risers!
I’ve been monitoring the discourse across Crypto Twitter (X) and have noticed a steady drumbeat of FUD and Hopium designed more to generate engagement than to provide clarity for Bitcoin holders. Seeing this noise prompted me to step in with an objective, data-driven framework.
By way of background, I worked as a quantitative data scientist and software architect from 2005 through 2021—including four years serving as a Vice President / Senior Architect IV at a major bank. Across a career spanning military intelligence, legal tech, casino analytics, and institutional banking (essentially Lawyers, Guns, Money, and Las Vegas), I’ve learned to focus on how systems mechanically clear under pressure rather than relying on sentiment or bad math.
However, public mathematical modeling often contains foundational econometric flaws. In particular, simplistic power-law models frequently suffer from improper boundary conditions, non-stationarity errors, and overfitted parameterizations. Furthermore, with the maturation of derivative rails and institutional market structure, I questioned whether the traditional four-year halving cycle remains a statistically significant driver of price formation.
That inquiry led to a multi-month research effort. The result is a formal econometric working paper applying wavelet spectral decomposition and variance compression across Bitcoin market regimes. You can access the full paper here.
The empirical findings are clear: while the four-year periodicity was a dominant harmonic in Bitcoin’s early eras, that cyclical signal has decayed significantly as spot and derivative market liquidity matured. In the post-January 2024 institutional regime, the four-year cycle signal no longer rises above background noise, and simple uncalibrated power-law extrapolations have broken down.
This is not a negative development—it simply reflects market maturation. In the paper, I provide the structural parameters of this current regime so that analysts and applied mathematicians can build more robust models.
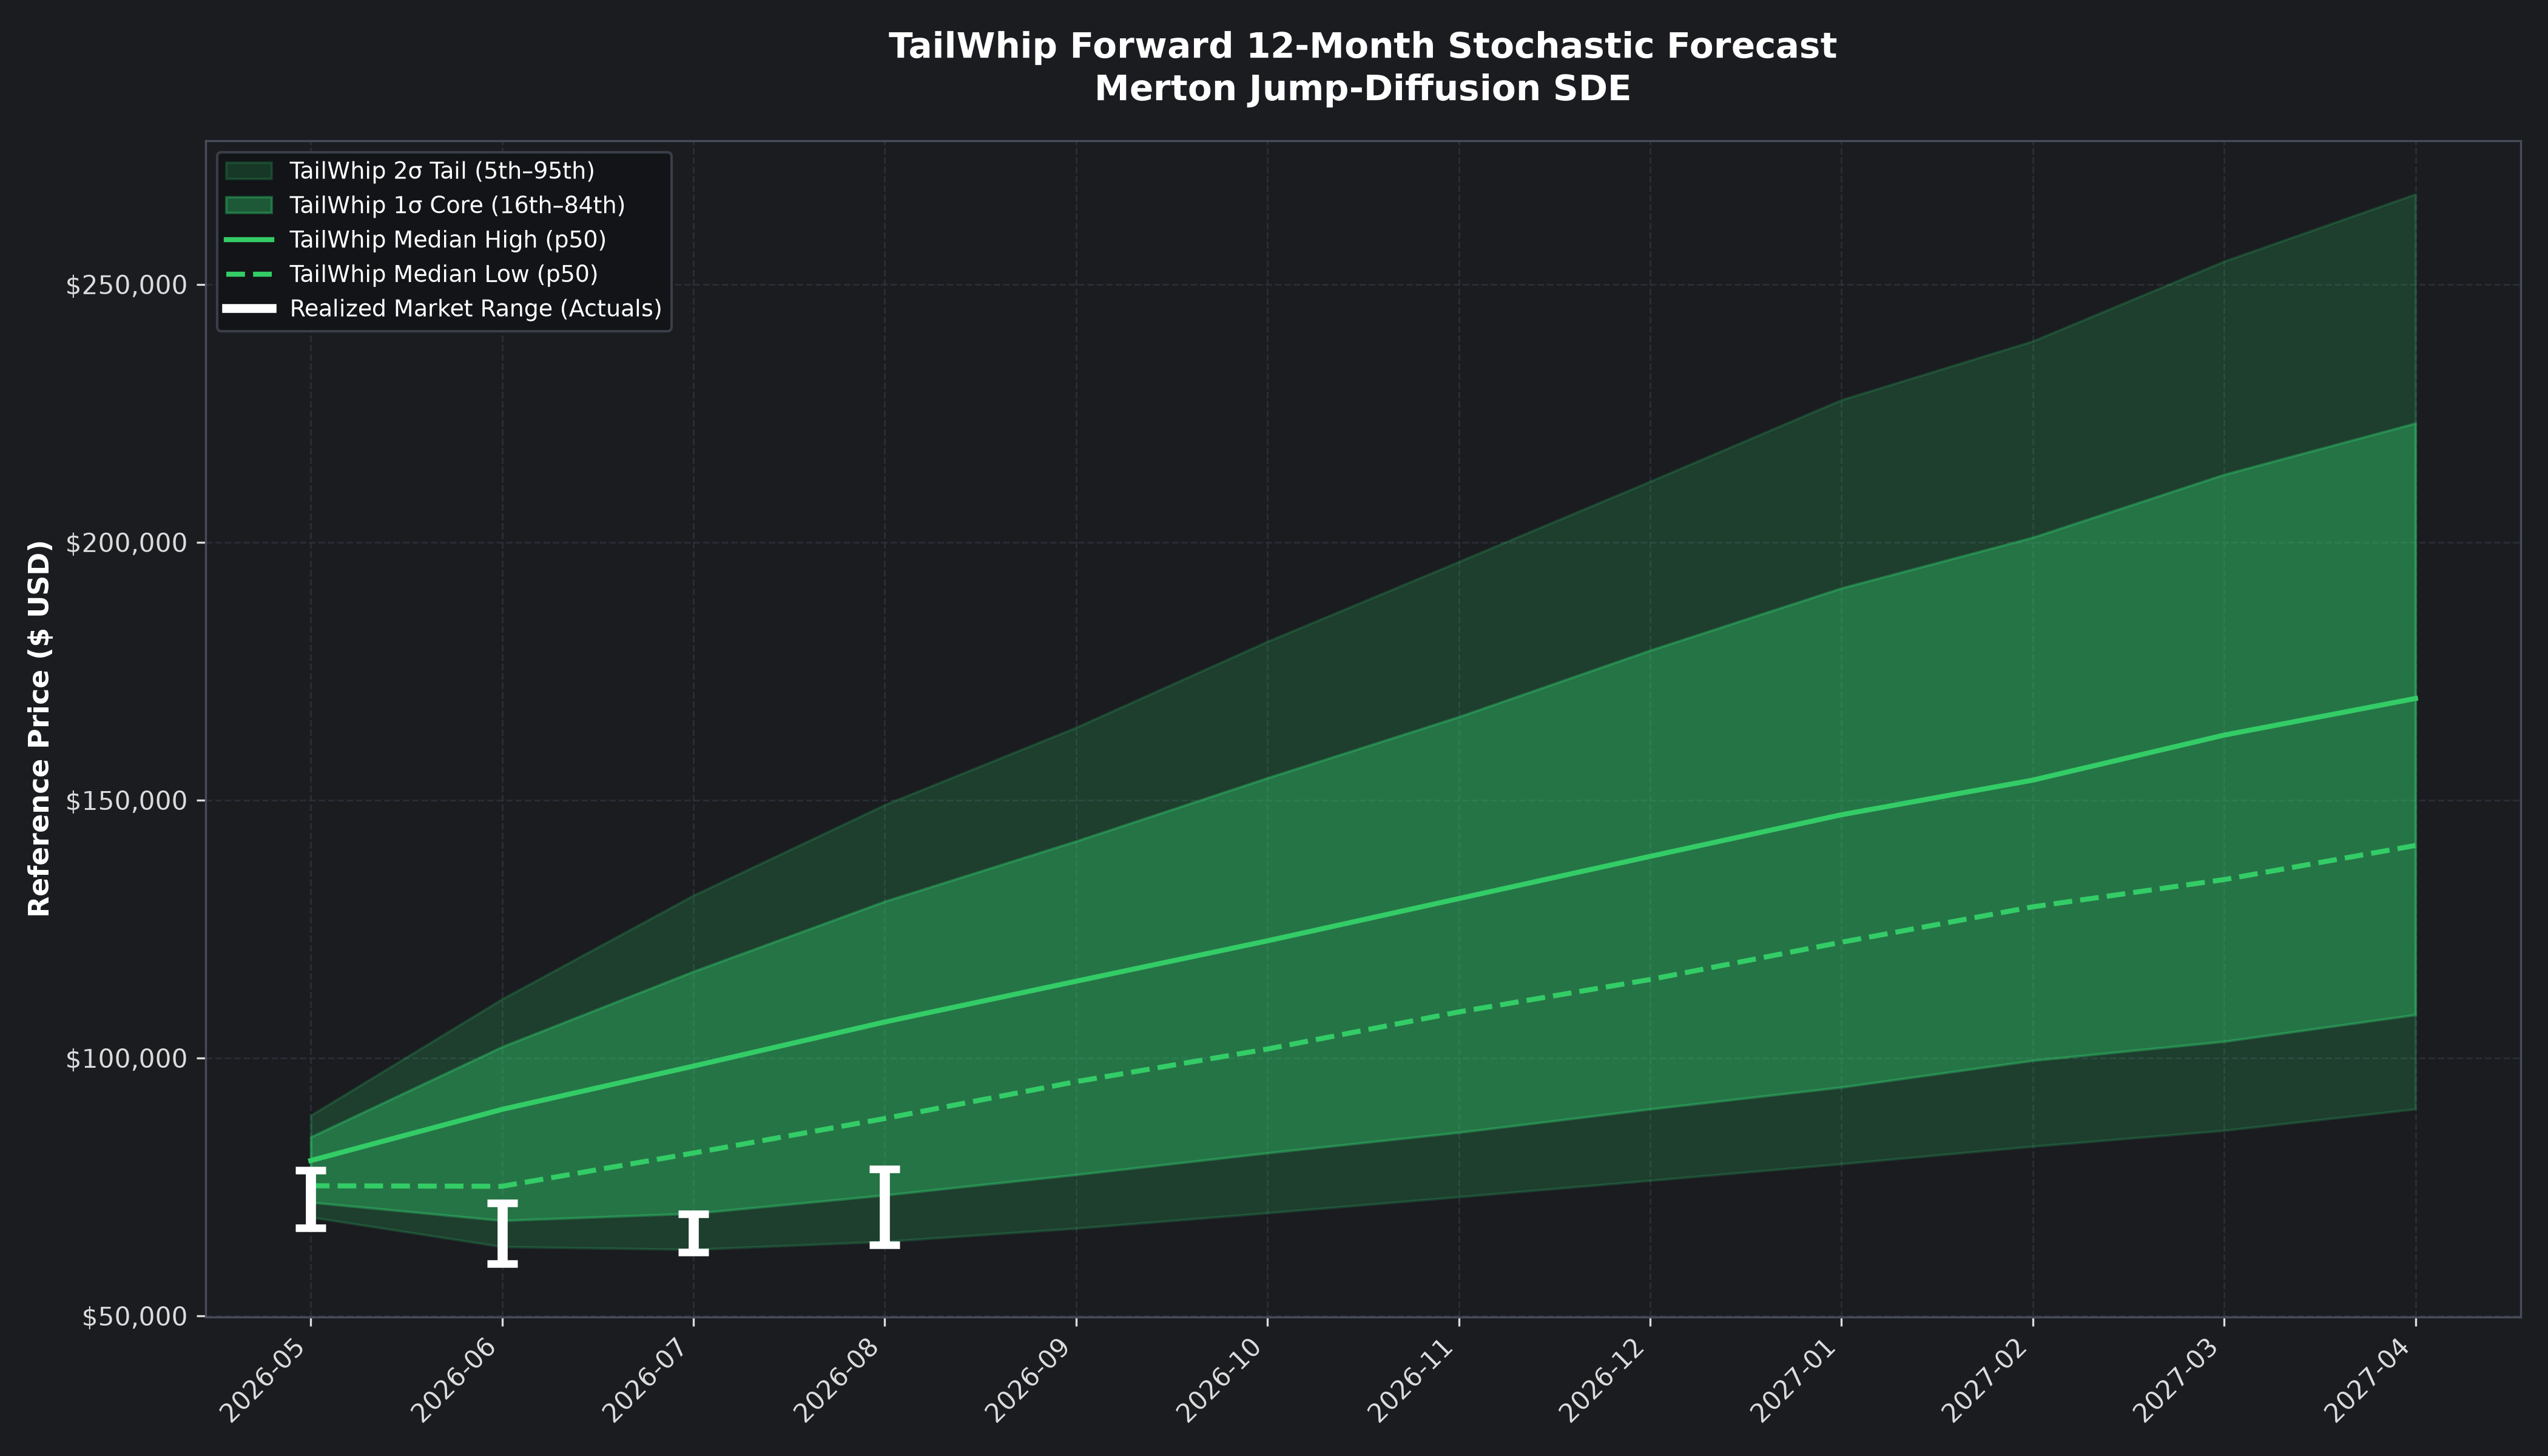
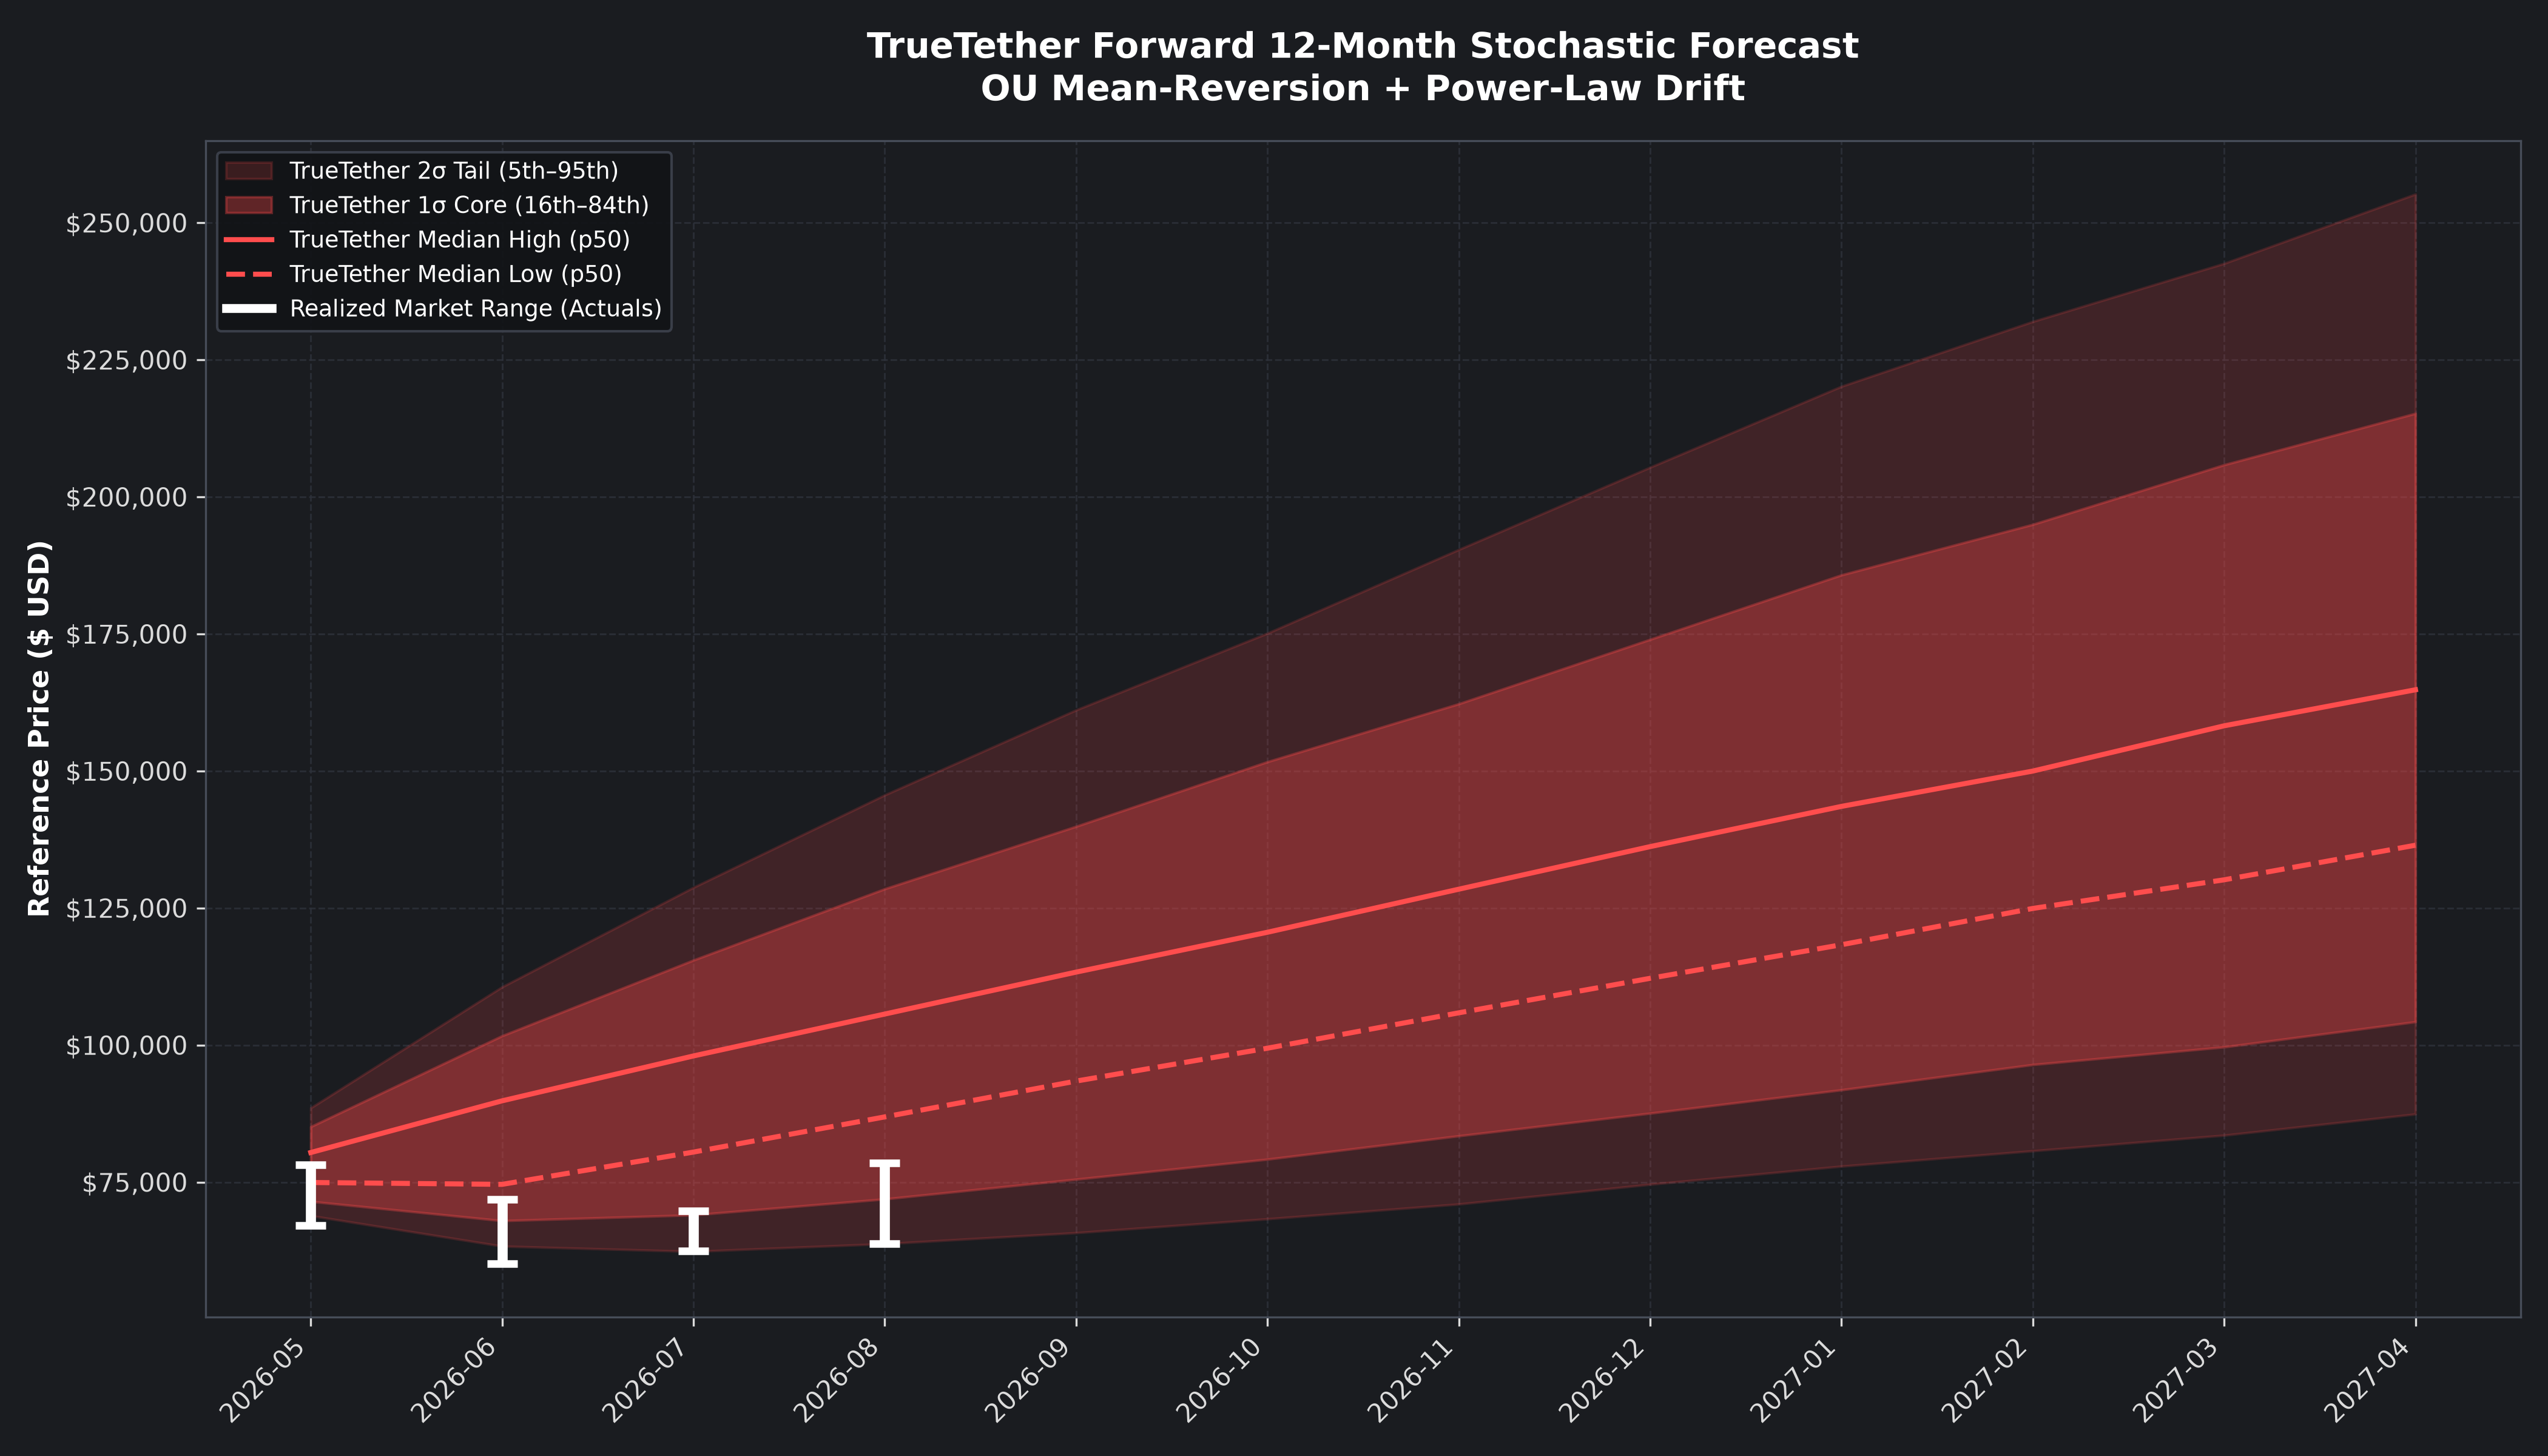
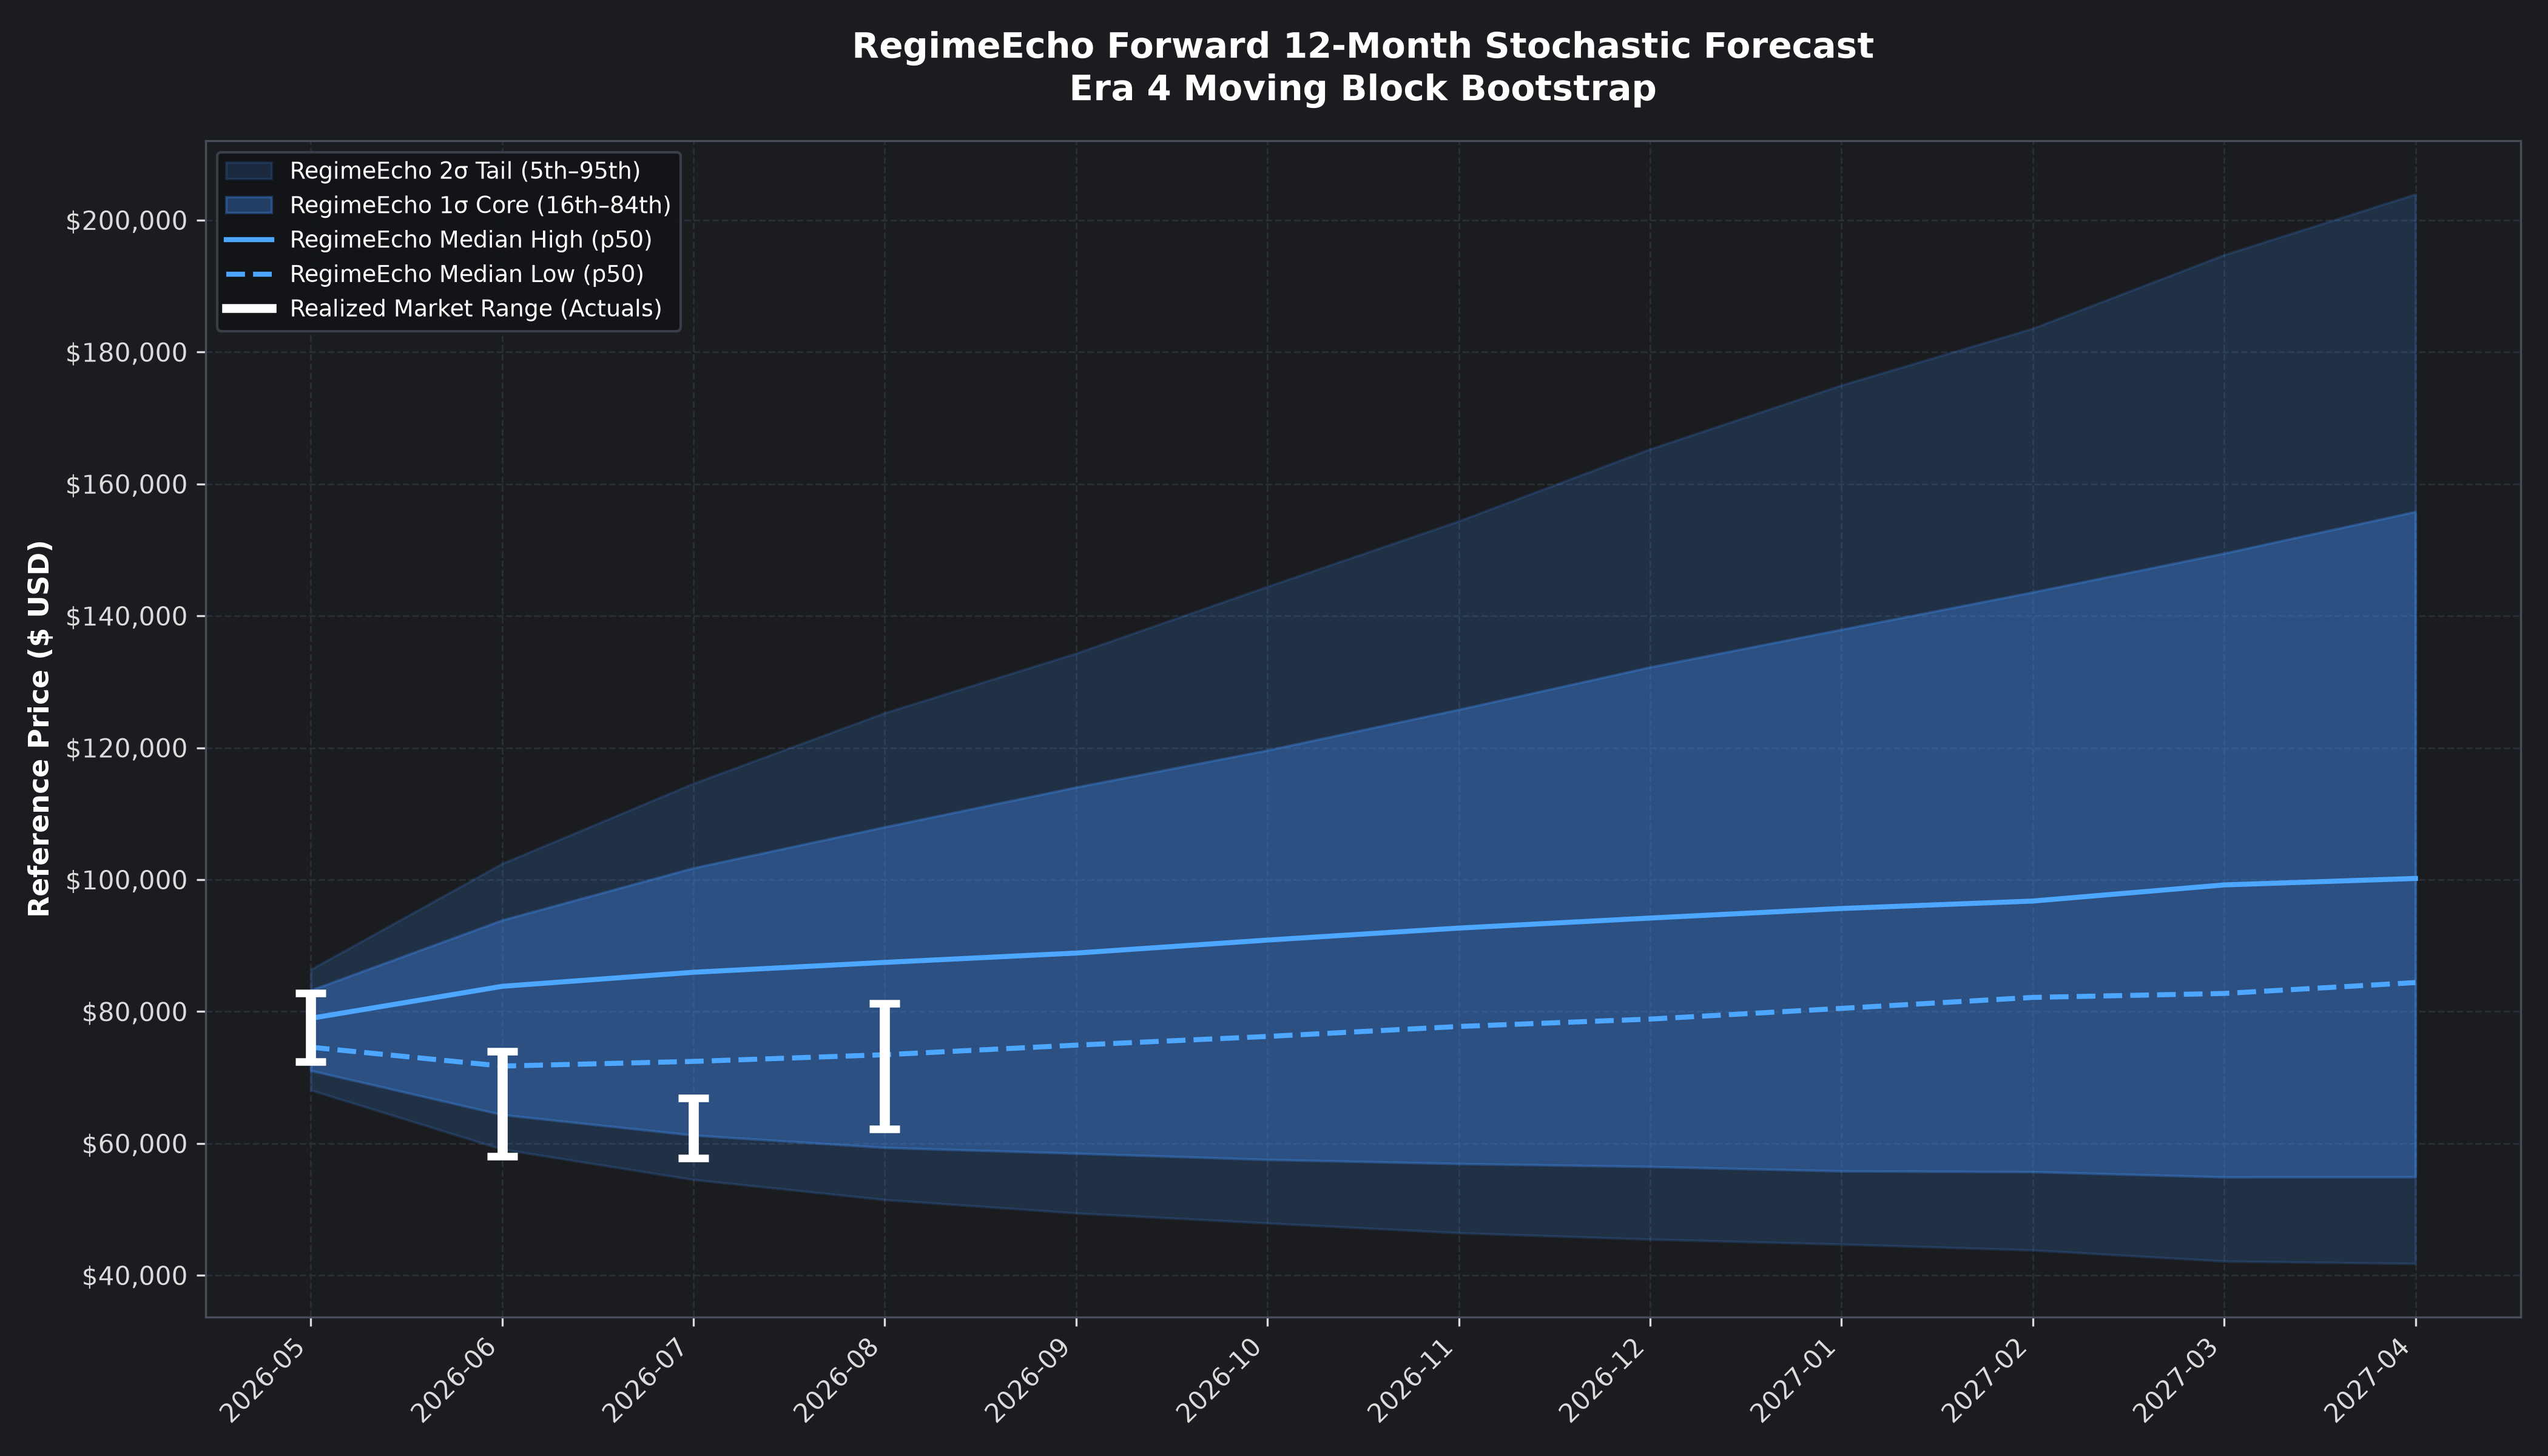
To track this regime dynamically, I developed three distinct stochastic forecasting models (with five additional specifications currently on the whiteboard):
- Model 1: TrueTether — Ornstein-Uhlenbeck (OU) Mean Reversion with Power-Law Drift
- Model 2: RegimeEcho — Moving-Block Stationary Bootstrap Backstop
- Model 3: TailWhip — Merton Jump-Diffusion Stochastic Differential Equation (SDE)
I will be publishing these model projections against realized price action going forward, updating the visual corridors at the close of each monthly candle.
Why Monthly Quantile Corridors ($P_{05}$, $P_{50}$, $P_{95}$)?
I have deliberately structured these forecasts at a monthly resolution rather than projecting daily or hourly price paths. In quantitative finance, high-frequency point forecasts across non-linear, stochastic assets are an exercise in false precision. Monthly aggregation allows us to properly model the return distribution, bound the forecast error, and capture regime shifts without chasing transient microstructure noise.
Rather than deterministic point targets, each model generates a probabilistic distribution corridor calibrated via Monte Carlo path simulations:
- $P_{50}$ Median Corridor: Represents dynamic baseline equilibrium, where price action consolidates under normalized volatility.
- $P_{05}$ Lower Bound: Marks the 5th-percentile stress boundary (cascade zones and structural capitulation floors).
- $P_{95}$ Upper Bound: Marks the 95th-percentile exuberance ceiling (statistically overextended upside).
Interpreting the Realized Overlay
Mapping realized price against fixed quantile bounds reveals regime state rather than simple directional bias.
When price tracks the $P_{50}$ corridor, the market is clearing in structural equilibrium. When it extends into the low-probability tails ($P_{05}$ or $P_{95}$), mechanical pressure builds across the order book. These extremes represent zones of liquidity exhaustion, crowded positioning, and punitive funding or carry rates, which significantly increases the mechanical probability of mean reversion back toward baseline.
Current Model Snapshots
Each model handles historical variance and jumps differently, but they share a key structural signal: Bitcoin price action across the current regime has been deeply compressed relative to model baselines.
Two of the three models indicate that price has spent extended time pinned near lower tail-risk boundaries. Recent upward expansion is not an isolated anomaly, but the natural mechanical release of compressed distributional energy. The conditions for an aggressive mean-reversion expansion remain highly primed.
Model 1: TrueTether — OU Mean Reversion and Power-law Drift
Model 2: RegimeEcho — Moving Block Backstop
Model 3: TailWhip — Merton Jump-Diffusion SDE